Client project · NTT DATA for Eurostat
Eurostat platform redesign
Turning complex European statistics into an accessible, intuitive public data platform for policymakers, researchers, journalists and citizens.
Context
Challenge and goal
The challenge
Eurostat’s public website is a critical resource for policymakers and researchers, but its interface made data hard to find and understand. Without a unified design system the experience was inconsistent, and poor accessibility excluded many users. The challenge was to untangle this complexity for a diverse, global audience.
The goal
Make data more accessible and engaging, with one measurable target: improve usability scores by 25%.
Research
What people needed
Findability
“I need to find data quickly and efficiently.”
Comprehension
“I need data presented in a way I can easily understand.”
Trust
“I need to be confident the data is accurate and reliable.”

Goals
- Find key inflation and unemployment figures
- Create a simple, clear chart for an article
- Verify the source and release date
Frustrations
- Digging through endless menus under deadline pressure
“I often just give up and find a less authoritative source because it’s faster.”
Process
How we got there
- 01Discover & define — Stakeholder workshops, user research and competitor analysis.
- 02Ideate & design — Personas, journey maps, wireframes and interactive prototypes.
- 03Test & iterate — Usability testing and data-informed refinements.
- 04Implement & measure — Handoff through the new design system and post-launch analysis.
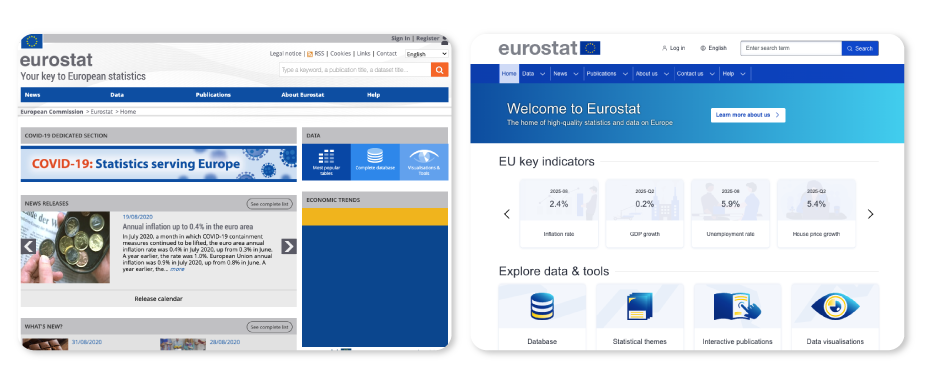
Before and after
The core shift, side by side.
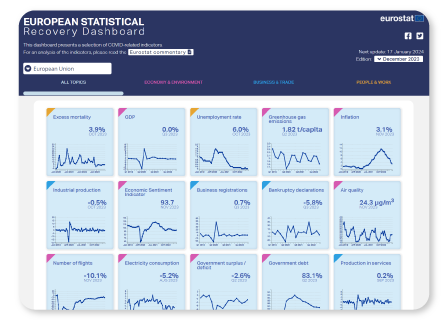
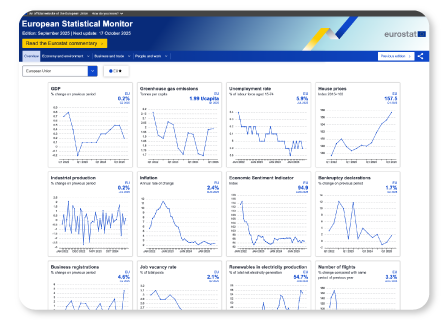
Customisable dashboards
Create, save and share personalised dashboards with the most-used datasets.
Data comparison tool
Select and visualise several datasets side by side, on the fly.
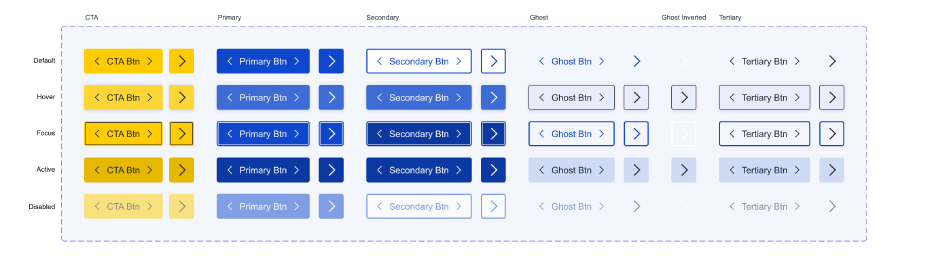
Unified design system
A Figma-based system that sped up development and kept the experience consistent.
Results
What changed after launch.
Usability
Measured usability scores improved post-launch, meeting the primary goal.
WCAG compliance
The platform meets modern accessibility standards for every user.
Shared design system
One Figma-based system across multiple applications, speeding up developer handoff.